


Sales success in 2025 requires more than just meeting quotas; it's about measuring, understanding, and optimising every aspect of the sales process.
With the right metrics, sales leaders can gain visibility into team productivity, identify bottlenecks, and make data-driven strategic decisions.
This guide covers the essential metrics that should be monitored and explains how tools like OneUp simplify tracking to help drive growth.
Why Tracking Sales Performance Metrics Matters
Data-driven sales managers harness the power of metrics to bring clarity to decision-making.
If you don't have concrete sales performance information to hand, it's challenging to make the smart strategic improvements that will steer your team to success.
But by providing clear insights into sales performance, using metrics to track sales performance makes educated guesswork a thing of the past.
Indeed, tracking sales performance metrics helps identify your team's strengths, weaknesses, and opportunities, enhancing productivity by guiding your focus and enabling you to prioritise effectively.
Once you've made improvements, keep tracking metrics to measure sales performance and ensure your tactics work.
Then, adjust and refine for optimal performance.
The result? More productive, efficient, and effective sales reps.
Metrics support strategic planning, too, enabling businesses to adjust tactics, forecast trends, and allocate resources effectively.
In essence, data-driven management makes sales efforts more targeted, efficient, and aligned with long-term business goals.
To sum up, using sales performance metrics leads to:
- Improved decision-making
- Better identification of areas for improvement
- Enhanced goal alignment
- Performance optimisation
20 Core Sales Performance Metrics to Track
In 2025, tracking sales performance metrics is an absolute must.
Your competitors are now equipped with real-time data vital to thriving in the tough B2B landscape of 2025 — and it's essential you keep up.
So, how to track sales performance?
And which metrics should you track to maximise performance?
Read on to discover 20 of the best sales performance metrics for B2B sales teams.
#1 Revenue Growth
When it comes to using sales metrics to measure performance, revenue growth is going to be top of your list.
The revenue growth metric measures the increase in a company's sales over a specific period.
It reflects how effectively the team generates sales, attracts new customers, and expands existing accounts.
Your revenue growth indicates overall sales health and team effectiveness, making it a primary indicator of sales success.
Tracking monthly or quarterly revenue growth rates helps you gauge short-term performance, spot trends, and adjust strategies promptly.
Armed with this key information, you can respond quickly to market changes or internal challenges.
Meanwhile, year-over-year revenue comparisons provide a longer-term perspective, showing how current performance stacks up against the same period in previous years.
This approach highlights seasonal trends, the impact of strategic changes, and overall business growth.
For best results, you should measure revenue growth over the short and long term.
Together, these metrics give leaders a balanced view of both immediate progress and long-term growth, enabling data-informed decisions and more effective planning for sustainable revenue increases.
#2 Quota Attainment
Quota attainment is a sales performance metric indicating the percentage of sales targets a team or individual salesperson achieves within a set period.
It shows how well they meet their targets and if their efforts align with revenue goals, helping to assess effectiveness and motivation and boosting forecasting accuracy.
High quota attainment reflects strong performance, while lower rates highlight areas needing improvement or support.
A useful way to track quota attainment is to record the percentage of reps hitting their quotas quarterly.
This helps sales managers assess team effectiveness, motivation, and overall sales productivity over this period, highlighting top performers and identifying those needing additional support or training.
It also reveals trends in goal attainment, indicating if targets are realistic or require adjustment.
By understanding quarterly performance, managers can implement timely strategies to boost team morale, align targets, and drive consistent sales growth across the team.
Tracking quota attainment manually is time-consuming and tedious — a large amount of data contributes to this metric, after all.
But tracking quota attainment is easy with cutting-edge performance management software like OneUp in your tech stack.

Integrate OneUp with your other tracking tools, enabling the platform to automatically draw real-time data from across your tech stack to populate custom dashboards and reports.
Then, use OneUp's custom dashboards and reports to track quota attainment and adjust goals based on the performance trends you identify.
#3 Win Rate
Tracking win rate is essential for sales managers because it shows the percentage of deals successfully closed, providing a clear measure of your sales strategy's effectiveness in converting opportunities.
A high win rate suggests strong sales strategies and effective team performance, while a lower rate may indicate areas for improvement.
By monitoring win rate, managers can use data to adjust their sales tactics, improve training, and optimise approaches to increase overall success in closing deals.
Breaking down the win rate by team or region helps determine which sales reps are smashing their targets and which need more help.
This insight allows for tailored training, strategy adjustments, and resource allocation.
What's more, monitoring regional and team-specific win rates ensures consistent performance improvements and enables targeted, effective decision-making across different areas.
Analyse your win rate in OneUp to identify high-performing reps or areas needing support.
OneUp reports and custom dashboards feature beautiful visualisations, making it easy to analyse your win rate at a glance.
#4 Sales Cycle Length
The sales cycle length metric reveals the average time it takes to close a deal.
A shorter cycle often means quicker revenue generation and higher sales efficiency, while a longer cycle may indicate inefficiencies or obstacles in the sales process.
However, many factors influence the length of your sales cycle, such as the price point of your product or service and what role your contact holds in their business.
That said, by monitoring sales cycle length, managers can identify stages where deals stall, optimise processes, and allocate resources better, improving sales velocity and forecasting accuracy for the business.
Try breaking down the average sales cycle length by product type or sales rep for deeper insights around performance.
#5 Lead Response Time
Tracking lead response time is essential for sales managers because it measures how quickly sales reps engage with new leads—a key factor in conversion success.
Faster response times increase the likelihood of engaging prospects before competitors, demonstrating attentiveness and building trust.
By monitoring this metric, managers can identify delays, improve response strategies, and ensure their team maximises conversion opportunities, ultimately boosting customer acquisition rates and overall sales performance.
Top tip — look at lead response time for specific teams or sales reps to identify where inefficiencies lie.
#6 Pipeline Conversion Rate
The pipeline conversion rate metric tracks how well leads convert at each sales pipeline stage, demonstrating your process efficiency.
Indeed, tracking pipeline conversion rates is vital for sales managers.
It's incredibly helpful to know the percentage of leads or opportunities that are moving from one stage of the sales pipeline to the next, ultimately resulting in closed deals.
This is because it helps you understand how effectively the team is nurturing leads through each stage, identifying any bottlenecks or drop-off points.
By understanding these rates, managers can refine sales tactics, provide targeted training, and adjust resource allocation to improve conversions.
Consistently monitoring pipeline conversion rates helps optimise the sales process, leading to higher close rates, better forecasting, and a more efficient, productive sales team that drives revenue growth.
There are plenty of ways you can slice up this metric, depending on what you want to find out.
For example, if you're looking for top-of-the-funnel insights, you might consider the percentage of prospects that make it from initial contact to meeting.
For a more holistic overview of the sales cycle, look at the conversion rate from initial contact to closed deal.
To measure the conversion rate from contact to closed deal, simply track the number of initial contacts made and how many resulted in closed deals over a given period.
This reveals how effectively a sales team turns initial contacts into successful sales.
A higher rate indicates that the team is proficient at engaging and nurturing leads through each stage of the sales process.
Conversely, a lower rate may highlight challenges in building rapport, addressing customer needs, or overcoming objections.
This metric helps sales managers identify areas for improvement, optimise the sales approach, and forecast revenue more accurately by understanding the likelihood of converting future contacts into paying customers
#7 Retention Rate
Customer retention rate is a vital sales performance metric as it reflects a business's ability to maintain its customer base over time.
Retaining customers is typically more cost-effective than acquiring new ones, and loyal customers often make repeat purchases, boosting revenue.
When it comes to performance, a high customer retention rate indicates both customer satisfaction and churn.
What's more, this metric helps identify areas for improving customer satisfaction and loyalty, guiding strategies to enhance relationships, reduce churn, and sustain long-term business growth.
It's worth breaking customer retention rate down by customer type, and looking at this quarterly or yearly so you can see the bigger picture.
After all — a senior executive purchasing a high-priced service with all the bells and whistles is likely to have different expectations than a more junior staff member who has gone for your most basic package.
#8 Churn Rate
A churn rate measures the percentage of customers lost over a specific period.
High churn can indicate customer satisfaction, product quality, or service delivery issues.
For sales leaders, tracking churn rate helps identify patterns and underlying problems, enabling proactive strategies to improve retention.
Reducing churn boosts revenue, enhances customer loyalty, and supports sustainable growth by ensuring customers stay engaged and satisfied.
You may want to track your churn rate by month and/or quarter to enable comparisons and determine the effectiveness of strategies to reduce churn.
#9 Sales Pipeline Velocity
Sales pipeline velocity measures how quickly deals progress through the sales pipeline to generate revenue.
To put it simply, faster pipeline movement means higher revenue, slower stages suggest friction and obstacles within your processes.
This provides important insights into the overall efficiency of the sales process.
Tracking pipeline velocity helps identify bottlenecks, optimise resource allocation, and forecast revenue more accurately.
By improving this metric, sales leaders can accelerate deal closures, enhance team performance, and drive consistent, predictable business growth.
A useful approach to measuring sales pipeline velocity is looking at the average length of time spent in each stage.
If, for example, time spent in the closing stage is significantly longer than it was this time last quarter, you can then look at what your team is doing differently or other factors that could be causing this and take swift action to reduce that number.
#10 Upsell and Cross-Sell Rates
Upsell and cross-sell rates measure potential revenue from existing clients and indicate a team's success in maximising customer lifetime value.
High rates reflect strong customer relationships and an understanding of customer needs.
Tracking these rates helps sales managers identify opportunities to increase revenue by offering additional or upgraded products and services to existing customers.
Focusing on these key sales performance metrics enhances profitability, customer satisfaction, and loyalty, supporting sustainable growth and efficient sales strategies.
To track these figures, look at the percentage of existing customers buying additional products.
Does one sales rep have especially high upsell and cross-sell rates?
Find out what they're doing differently to their colleagues and ask them to provide training for the rest of the team.
Again, manually tracking upsell and cross-sell rates is incredibly time-consuming — especially for bigger businesses.
Use OneUp to automatically populate your customer upsell and cross-sell dashboard with real-time data from across your tech stack.
This way, you can see at a glance how your team is performing when it comes to upselling and cross-selling specific products or services.
You can then adjust your approach based on this information to optimise your upselling and cross-selling strategies.
#11 Forecast Accuracy
Forecast accuracy is a critical sales performance metric as it looks at the accuracy of revenue predictions against real-world outcomes.
As any sales leader knows, the accuracy of your forecasts significantly impacts planning and resource allocation, not to mention goal-setting and strategic planning.
Tracking this metric helps align expectations across teams and stakeholders while minimising risks from overestimating or underestimating sales performance.
Run a quarterly forecast accuracy report to boost operational efficiency, enable informed decision-making, and strengthen overall business stability and growth.
#12 Percentage of Sales by New vs. Existing Customers
Tracking the percentage of sales by new versus existing customers provides insights into business growth and customer loyalty.
A healthy balance indicates strong customer retention and effective acquisition strategies.
Analysing this metric helps you balance your growth strategies between acquisition and retention and identify areas needing improvement, such as optimising marketing for new customer outreach.
Armed with this data, you can make more strategic decisions, ensuring sustainable revenue generation and a well-rounded sales approach.
When tracking this metric, break your data down by customer type.
What type of customers are the most loyal to your brand? And how can you reinforce this?
Which customers are the least loyal? Why is this? And how can you change it?
#13 Deal Loss Reasons
Tracking deal loss reasons reveals why opportunities fail to convert, providing valuable insights into potential weaknesses in the sales process.
Understanding these reasons helps identify gaps in product offerings, pricing, or customer engagement strategies.
By addressing recurring issues, managers can refine sales approaches, improve team training, and adapt to customer needs, ultimately reducing future losses and boosting overall sales performance and competitiveness.
For example, if 80% of your deal loss reasons are related to price, it may be worth revisiting your market research.
Look at your competitors and industry benchmarking data to find out whether you should lower the price of your product or service, or improve it to deliver better value for money.
#14 Time to Productivity for New Sales Reps
In sales, teams grow quickly, and there's often a higher turnover rate than in other departments.
This means time to productivity is a particularly useful metric for sales leaders.
Simply put, it measures how quickly new hires can start contributing to revenue generation.
Tracking this metric — for example, recording the average time to first sale — helps sales managers identify the efficiency and productivity of onboarding and training processes.
A shorter time to productivity means faster integration into the team and quicker results.
It also highlights areas where training or support might need improvement, ultimately enhancing overall sales team efficiency and performance.
#15 Net Promoter Score (NPS)
Your net promoter score (NPS) is a crucial sales performance metric as it measures customer loyalty and satisfaction.
This illustrates how likely customers are to buy from you again or to recommend a product or service.
A high NPS indicates strong customer satisfaction, potentially leading to repeat business and referrals, while a low NPS highlights areas for improvement.
Tracking NPS helps sales managers identify potential issues, adjust strategies to improve customer relationships, and prioritise customer retention, ultimately driving growth, reducing churn, and enhancing long-term revenue generation.
This is another metric that should be segmented by customer type.
For example, suppose you have a high NPS score from customers in more junior roles at their companies and a much lower one from senior leaders.
This suggests you should adjust your marketing and sales approach. For instance, perhaps your informal approach is off-putting to execs, and you need to be less casual when communicating with this type of client.
#16 Lead-to-Opportunity Conversion Rate
Lead-to-opportunity conversion rate measures the effectiveness of turning initial leads into viable sales opportunities.
Tracking this conversion rate provides important insights around the efficiency of lead qualification and your sales funnel, as well as the sales team's ability to engage potential customers.
A high conversion rate suggests a well-targeted lead generation strategy and strong sales processes.
Conversely, a low conversion rate highlights areas where the team may need improvement, such as in lead nurturing or messaging.
Monitoring this metric helps optimise the sales funnel, ultimately increasing sales opportunities and boosting overall revenue growth.
#17 Sales Rep Activity Completion Rate
When it comes to tracking performance, you need to look at granular metrics as well as the bigger picture.
Tracking sales rep activity completion rates, such as calls completed, meetings attended, and follow-up tasks completed, helps to ensure that reps stay on track with their daily tasks and consistently engage with prospects and customers.
Got a high activity completion rate?
Congratulations — you've got yourself a motivated and disciplined team.
On the other hand, a low rate suggests potential issues with time management or workload.
By monitoring this metric, managers can quickly get to the root of any productivity issues on their team before they snowball into bigger problems.
They can then provide timely support, improve sales processes, and ultimately enhance sales performance and productivity.
Staying on top of your team's daily activities is easy with OneUp, which automatically pulls completion rate data from your tech stack and feeds it into easy-to-understand custom dashboards with intuitive visualisations.

#18 Average Deal Size
Average deal size measures the typical value of deals closed by the sales team.
A larger average deal size typically indicates strong sales skills, effective negotiations, and the ability to upsell or cross-sell.
For sales managers, tracking this metric helps to gauge the revenue potential of individual sales and whether your team has the ability to target higher-value opportunities.
It also helps you assess the overall revenue potential of the sales pipeline, optimise pricing strategies, and ensure that the team focuses on deals that contribute most to business growth and profitability.
#19 Customer Lifetime Value (CLV)
Customer lifetime value (CLV) calculates the total revenue a customer is expected to generate throughout their relationship with the business.
Unsurprisingly, this is super useful information for any sales manager.
Indeed, tracking this metric helps assess the long-term value of customers and the effectiveness of retention strategies.
A higher CLV indicates strong customer loyalty and satisfaction, while a low CLV may signal areas for improvement in customer engagement or product offerings.
Monitoring this metric allows you to focus on high-value customers, optimise sales efforts, and make informed decisions about resource allocation, ultimately driving sustained revenue and business growth.
Remember — when analysing your CLV data, it's worth segmenting your customers into different customer types for deeper insights and better outcomes.
For example, you may want to segment by industry, company type or size, or job role.
#20 Customer Acquisition Cost (CAC)
It's important for sales leaders to know how much it costs to acquire a new customer.
Customer acquisition cost (CAC) is a key sales performance metric that measures exactly this, taking into account marketing, sales, and other related expenses.
It looks like this:
CAC = Total Sales and Marketing Expenses / Number of New Customers Acquired
For sales managers, tracking CAC is essential for evaluating the efficiency of sales and marketing strategies.
A high CAC can indicate that resources are being spent inefficiently, while a low one suggests effective customer acquisition.
By monitoring this metric, managers can identify opportunities to optimise spending, improve conversion rates, and balance customer acquisition efforts with revenue generation.
Ultimately, keeping CAC in check ensures profitability and supports sustainable business growth.
How to Use Sales Performance Metrics for Continuous Improvement
So, how do we take the sales performance metrics examples outlined above and use them to improve sales performance?
Here's a handy four-step process to follow.
#1 Establish Benchmarks and Goals
When it comes to key metrics for sales performance, your first step should always be benchmarking and setting goals.
Compare your sales team performance metrics against industry standards or top-performing competitors to find out where you sit in the market.
Identify strengths, weaknesses, and areas for improvement.
Once you've established where you currently are and where you want to be, set SMART goals for your sales reps and your overall team.
SMART goals are:
- Specific
- Measurable
- Achievable
- Relevant
- Time-bound
An example of a goal that is not SMART would be:
"Increase revenue in the coming year".
If we turn this into a SMART goal, it looks more like:
“[SALES REP] should hit [£ REVENUE TARGET] by [DATE]”
It's essential that you draw on your benchmarking exercise to ensure these SMART goals are achievable.
It's a fine line — you want to set ambitious goals but don't want to set your team up for failure.
This is why it's vital to look closely at the state of the economy and your market when goal-setting.
#2 Leverage Technology for Automation
Once upon a time, accurately tracking the metrics above would have been a full-time job.
But with cutting-edge automation tools on the market, it now barely has to take any time at all.

Invest in a CRM and sales performance analytics tools like OneUp that come with in-build automation in order to track metrics in real-time.
These tools automate data collection, processing, and reporting, eliminating manual tasks and reducing errors.
Features like automated custom dashboards, AI-driven insights, and predictive analytics help managers monitor KPIs, identify trends, and make data-driven decisions.
It's vital to check out each tool's integrations before purchasing to ensure they work with your existing tech stack.
For example, OneUp integrates with a wide variety of CRMs, VoiP tools, timesheets software, and sales enablement platforms.

#3 Foster Accountability and Feedback
It's all well and good to track the metrics above, but it's vital your team engages with the process too.
After all, the whole point of tracking sales performance metrics is to enhance your team's performance.
But it's unlikely to have the desired effect if they don't pay attention to their results.
You can foster accountability and feedback on your team by setting clear SMART goals and aligning them with measurable metrics, as outlined above.
But communication is critical for bringing your team on board.
Regularly review these metrics during team meetings to ensure transparency and empower sales representatives to take ownership of their goals.
Providing timely, constructive feedback based on performance data in one-to-one meetings helps individuals identify strengths and areas for improvement.
Sales managers can also implement peer reviews or collaborative discussions to encourage shared learning.
By recognising achievements and addressing challenges promptly, you can create a culture of responsibility and continuous improvement.
Remember — leveraging technology, such as CRM systems and analytics tools, enables real-time tracking, fostering open dialogue and reinforcing accountability within the sales team.
#4 Review and Adjust Metrics Regularly
You've established your benchmarks and your SMART goals, your metrics are set up, and your data analysis is automated.
But the work doesn't end there.
Sales managers must regularly review and adjust sales performance metrics to align with evolving business goals, market conditions, and customer needs.
Metrics that remain static may become outdated, leading to inaccurate assessments of team performance that hamper your progress.
Regular reviews help identify trends, refine strategies, and maintain relevance.
Continuously analyse data and industry benchmarks and ask for input from your team to address practical challenges.
Adjustments can involve introducing new KPIs, modifying targets, or reallocating resources.
This proactive approach ensures metrics remain meaningful, enabling the team to stay agile, focused, and competitive in achieving sales objectives.
How OneUp Simplifies Sales Performance Tracking
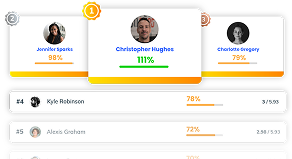
OneUp is a sales performance management platform that simplifies performance tracking and motivation, helping you drive high performance on your team.
It makes creating and running a data-driven strategy easy.
With OneUp, you can create custom dashboards and reports to easily track any sales performance metric.
With a wide range of integrations, the sales performance platform automatically pulls real-time data from across your tech stack into your reports and dashboards.
This means you only have to set up each report or dashboard once — and then you can simply check it for an up-to-the-minute performance overview.
And beautiful visualisations make it easy to analyse any situation at a glance.
You can even automate reports, setting them up to land in your inbox whenever you need them.
What's more, OneUp has a variety of fun gamification tools to help you motivate your team to success.
So, how to motivate your sales team?

Harness the power of its real-time leaderboards, missions, leagues, and automated celebration anthems to create a high-performance culture on your team.
Launch sales competitions that are tracked on leaderboards displayed on screens around your office.
Sales reps will be able to quickly see how their performance compares to their colleagues' and how close they are to winning the prize.


