


What if OneUp got better every single month?
That’s our mission. The Product Drop is our new monthly update where new and upgraded features are added to the platform. We’re excited to share our latest improvements, designed to make insights clearer, dashboards smarter, and your workflows even smoother.
Your dashboard is now a collaborative workspace.
Based on your feedback, we've overhauled the dashboard experience. It's now a true command centre where teams can build, share, and manage insights together.
Bring full Reports and Charts to the dashboard.
Bring your favorite Charts and Reports straight to your Dashboard! Now, consultants can get a visual snapshot of key data in one place, making insights clearer and decision-making quicker.
Build smarter, faster, and together.
Dashboards are now collaborative, helping your teams work smarter by having multiple editors. Skip the blank canvas with new dashboard templates put together by OneUp experts, and see everything in one central place with the new Dashboard Manager.
Design beautiful, engaging layouts.
We’ve made it easier for you to create Dashboards that look great. Widgets now come in one of three consistent sizes and slot together easily, keeping your teams engaged with a clean, predictable layout.
Find insights in seconds, not hours.
We’ve redesigned our analytics tools to help you go beyond surface-level data, spot trends instantly, and find the "who" behind every number.
A faster, simpler way to build charts.
Our Charts feature has had a refresh. The improved UI includes dragging and dropping, reordering metrics with ease, and multiple time period comparison, so you can instantly spot trends over time with just a few clicks.
Go from metric to mentor in two clicks.
We’ve added more depth to Client, Candidate, and Job Reports. You can now drill down into any metric to see the users (and teams) who completed the activity. This is perfect for uncovering insights like whether two teams are sending CVs for the same job.
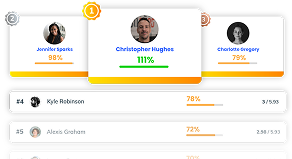
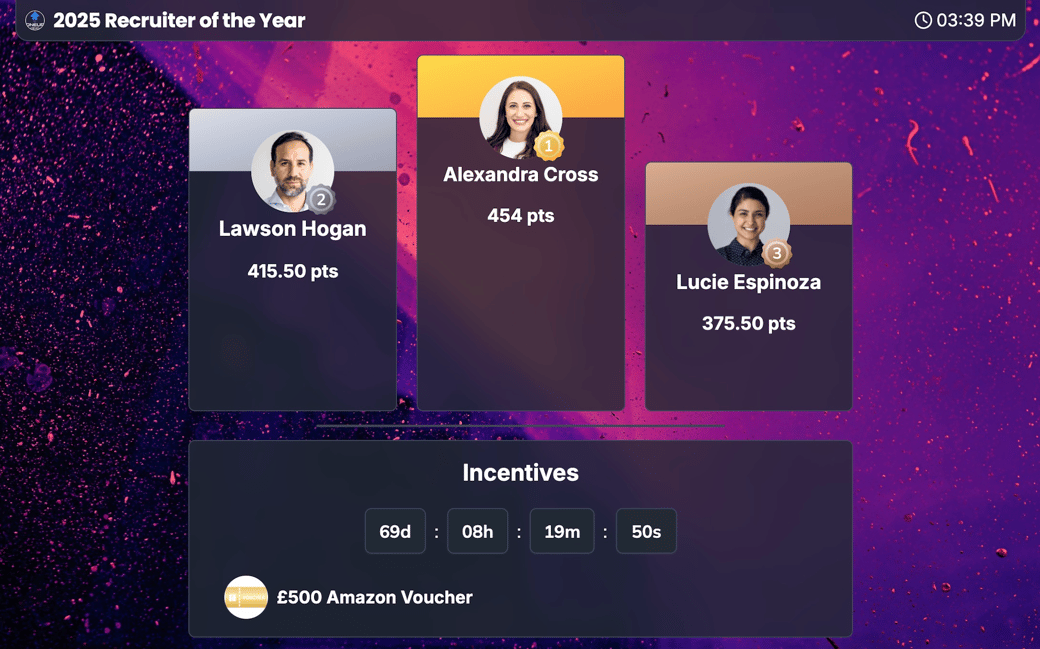
Bring team success to the big screen.
Your data has never looked so good. Our new and improved OneUpTV now offers a more intuitive experience to help teams gain deeper insights, right from your office wall.
A more intuitive TV experience.
The redesigned interface includes features like slide preview and, most importantly, advanced Report and Chart slides, helping teams see the data that matters most.