Measuring leading and lagging indicators in sales performance
Neither leading nor lagging indicators are useful on their own. You need more information to make them useful.
Lagging indicators confirm whether a sales person hit target, but leading indicators will explain why, and give someone the chance to make alternative behaviours before the end of the chosen period.
As Harvard Business Review's guide to moving from strategy to execution says, “strategy only becomes real results when leaders track the actions that drive outcomes, not just the outcomes themselves.”
That describes the relationship between leading and lagging indicators in a sales context.
Leading indicators examples
Common leading indicators in sales include:
• Calls or dials made
• Emails or outbound touches sent
• Meetings booked
• New opportunities created
• Pipeline value generated
• Proposals or demos delivered
• Follow-up activity/response time to leads
Lagging indicators examples
Common lagging indicators in sales include:
• Revenue / bookings
• Quota attainment
• Win rate
• Average deal size
• Sales cycle length
• Customer retention / churn rate
Understanding each indicator when measuring sales performance
The distinction between the two indicators of success isn't always set in stone.
For example, a metric can act as a leading indicator for one outcome and a lagging indicator for another. Meetings booked, for example, is a lagging measure of prospecting activity, but a leading indicator of future pipeline.
It shows work being done in the current timeframe to make sales right now, but also predicts future success with the importance of rapport building and relationships so paramount to long-term sales and account management.
The useful question isn't necessarily "which category does this metric belong to?" but "does this number tell me what to do next, or does it tell me what already happened?"
Sales teams that build their reporting around that distinction, rather than tracking whichever metrics are easiest to pull, tend to catch performance issues weeks earlier than teams relying on lagging data alone.
EBSCO's overview of key performance indicators reinforces this idea. “KPI frameworks work best when they combine both indicator types rather than leaning on one exclusively.”
Leading and lagging indicators by role
The right mix of leading and lagging indicators changes significantly depending on the role of the salespeople in the business, or how the work’s split up between teams.
Each part of the sales team will influence a different stage of the funnel.
SDRs and BDRs
SDR and BDR performance is almost entirely leading-indicator driven, since their job is to generate the pipeline that later becomes revenue.
Typical leading indicators include calls, emails, and meetings booked, the main lagging indicator is meetings that convert into accepted opportunities.
SDR quotas are usually a blend of activity and outcome metrics, but overemphasising raw activity without tracking conversion can drive motion without actually moving the needle on pipeline.
Account Executives (AEs)
AEs sit closer to the lagging end of the spectrum, since their core measure of success is revenue.
Quota attainment, win rate, and average deal size are the primary lagging indicators. But leading indicators still matter for AEs, pipeline coverage ratio, number of active opportunities, and stage-to-stage conversion rates all help predict whether an AE is on track before the quarter ends.
Account Managers (AMs)
For AMs, leading indicators tend to centre on relationship health and expansion activity, so check-in frequency, renewal conversations scheduled, upsell opportunities identified, and product usage or engagement signals from existing accounts.
The lagging indicators are renewal rate, net revenue retention, and expansion revenue, numbers that confirm whether that relationship-building activity actually protected and grew the account.
How to monitor leading and lagging indicators for sales leaders
The hardest part of using leading and lagging indicators well isn't deciding which metrics matter, but actually seeing them, together, in real time.
Most sales leaders end up pulling activity data from a CRM, revenue data from a separate reporting tool, or even forecasting numbers from a spreadsheet, which means by the time everything’s compiled into one unified view, the leading indicators are no longer leading anything.
They've become as stale as the lagging indicators and as old hat as the spreadsheet they’re being read from.
This is where OneUp Sales' dashboards and reporting come in.
A sales analytics software that allows you to" pull live data directly from your CRM and other sales tools into a single view, will allow sales leaders to see both leading indicators (activity, pipeline movement) and lagging indicators (revenue, attainment) side by side, updated in real time.
Rather than waiting for a weekly or monthly report to find out a rep's activity has quietly dropped off.
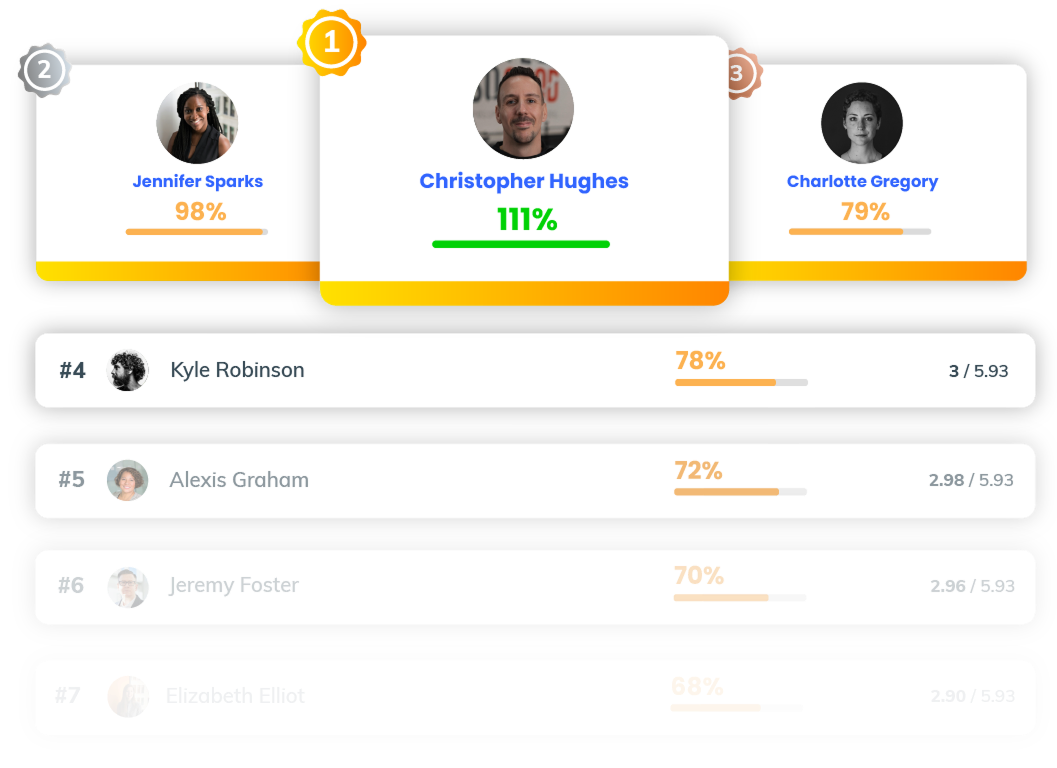
Paired with real-time leaderboards and alerts, it also means the leading indicators that matter most, like calls made, meetings booked, deals moved forward stay visible to reps themselves throughout the day, not just to managers after the fact.
This actually improves the chances of sales staff hitting the numbers as there’s an ongoing frequent reminder how they’re fairing. Alongside competitions and motivators, this knowledge is powerful in improving the chances of sales teams hitting their numbers.